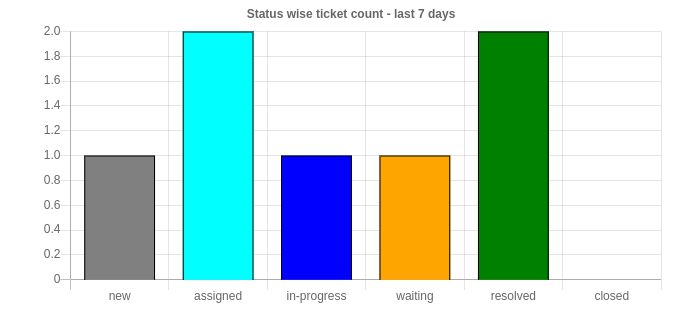
We will be using charts.js to draw a bar chart in Django application.
How to start with Django. Develop hollo world application In Django.
In your view.py file, prepare the data and return the rendered template.
def sample_bar_chart(request):
    data = {
        "status_lables": ["new", "assigned", "in-progress", "waiting", "resolved", "waiting", "closed"],
        "status_count": [1, 2, 2, 1, 1, 2, 0]
    }

    return render(request, 'appname/chart.html', data)
In your template file i.e. chart.html, write the below code.
<div class="row">
    <div class="col-md-6">
        <canvas id="myChart" style="width:100%;"></canvas>
    </div>
</div>
Add the script part.
<script>

var barColors = ["grey", "cyan", "blue", "orange", "green", "black"];

new Chart("myChart", {
  type: "bar",
  data: {
    labels: {{status_labels | safe}},
    datasets: [{
      backgroundColor: barColors,
      data: {{status_count}},
      borderColor: "black",
      borderWidth: 1
    }]
  },
  options: {
    legend: {display: false},
    title: {
      display: true,
      text: "Status wise ticket count - last 7 days"
    }
  }
});

</script>
Since Django template rendering system will convert the special characters like double-quotes into HTML entities, we need to use the 'safe' filter for string list.
{{status_labels | safe}}Now import the Chart.js file from CSN.
<script src="https://cdn.jsdelivr.net/npm/chart.js@2.9.3/dist/Chart.min.js"></script>
The complete HTML file should look like this.
<!DOCTYPE html>
<html lang="en">
<head>
    <meta charset="UTF-8">
    <meta name="viewport" content="width=device-width, initial-scale=1">
    <title></title>
    <script src="https://cdn.jsdelivr.net/npm/chart.js@2.9.3/dist/Chart.min.js"></script>
</head>

<body class="wrapper container">

<div class="row">
    <div class="col-md-6">
        <canvas id="myChart" style="width:100%;"></canvas>
    </div>
</div>

<script>

var barColors = ["grey", "cyan", "blue", "orange", "green", "black"];

new Chart("myChart", {
  type: "bar",
  data: {
    labels: {{status_labels | safe}},
    datasets: [{
      backgroundColor: barColors,
      data: {{status_count}},
      borderColor: "black",
      borderWidth: 1
    }]
  },
  options: {
    legend: {display: false},
    title: {
      display: true,
      text: "Status wise ticket count - last 7 days"
    }
  }
});

</script>


</body>
</html>
Run the development server, python manage.py runserver, and go to localhost:8000, HTML page will render with a bar chart.

Host your Django Application for free on PythonAnyWhere.
If you want complete control of your application and server, you should consider DigitalOcean. Create an account with this link and get $200 credits.


